Thursday, June 6, 2019

Volumetric in ArcMap

Intro:
Volumetric analysis is a simple skill that is invaluable because it separates the pros from the average data collector. It is also something that can ruin your reputation if you are bad at it because surveyors will run their own data and find the discrepancies in your data.

Methods:

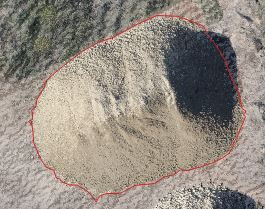
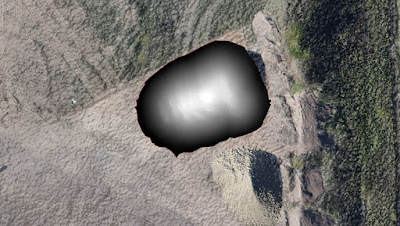
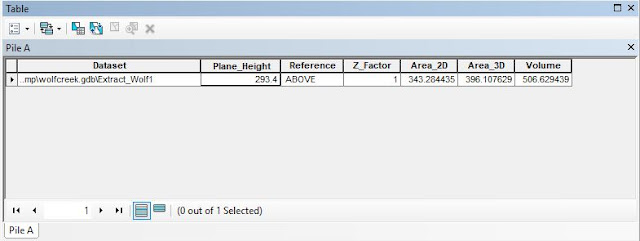
I used ArcMap to find the volume of a pile and the entire mine. I pulled up the DSM and Hillshade from the Wolfcreek mine. The first step is to clip the image around the pile I wanted to measure. It is important to make this as accurate as possible so there is little to no skewed data. Next I used "Extract by Mask" to make the cookie cutter image of the pile. Then i used the "Identify" tool to find the base level. Then I used "Surface Volume"  where I put in the base level and had it find the data above the base level. After this the data from the file will be shown. Figures 1-4.

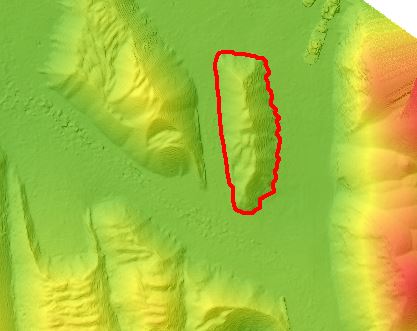
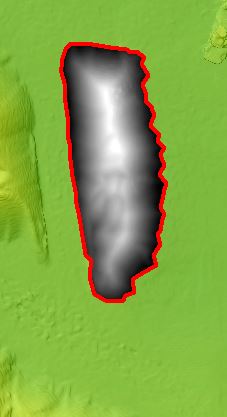
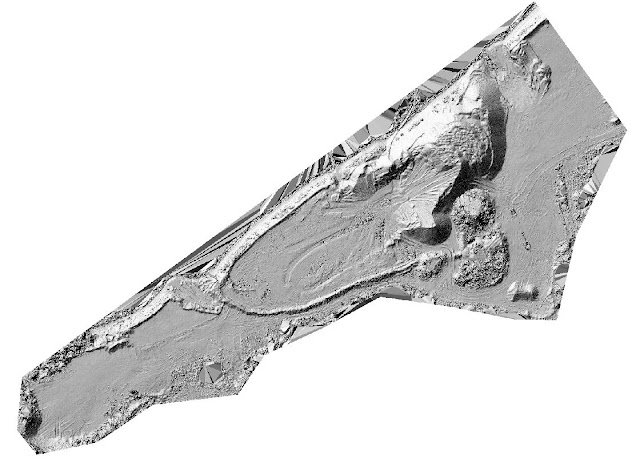
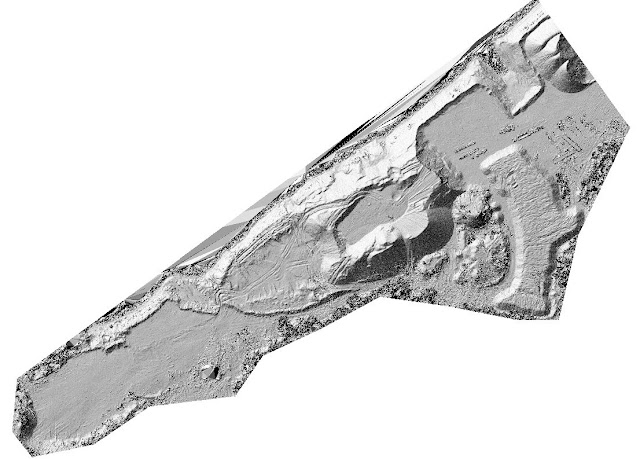
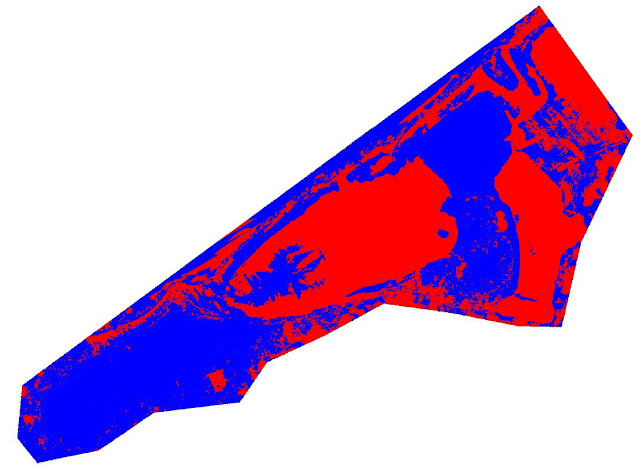
To demonstrate the Cut-Fill for Litchfield I used ArcMap as well. I used Images collected on 07/22/2017 and 09/30/2017. I transferred the DSM of both images over to ArcMap. The first step is to use the "Resample" tool to make the images move from sub-millimeter accuracy to 10 centimeter accuracy. this enlarges the pixels because we don't need every little divot in the pile, and it will also save us a lot of time while analyzing the data. Then use the "Cut-Fill" tool and input the first image (07/22/2017) in the first raster data set then the second image (09/30/2017) in the second raster data set. This makes the data compare where the material is in the first image (07/22/2017) to where the material is in the second image (09/30/2017). Figure 5-7.

Discussion:
You can follow the steps from above to figures 1-4 below to get a better view of what I did to collect the data. A lot of what I did in this post is very similar or exactly what I did in the "Open Source GIS and Volumetrics" post right before this post.

Figure 1: Shows the full Orthomosaic of the Wolfcreek mine with. The blacked out area in the top right corner is the pile I did the analysis on.

Figure 2: This is where I plotted my line out around the pile to create the cookie cutter layer of the image.

Figure 3: This is where I found my base level to input into the surface volume tool to find the volume of everything above this level.

Figure 4: This is the data I received after. This is the final product that you will need to turn into your clients unless the want the weight of the pile, I will go over how to find that out in the next step. The base level is the height that the software calculated everything above in the blacked out section (293.4 m). The Grid Volume is the actual volume of the actual pile (506.629439 cubic meters).

Figure 1
Figure 2
Figure 3
Figure 4
For the Cut-Fill of the Litchfield mine the images are below Figures 5-7.

With Figure 7 the Red area is where material was gained, the Blue area is where material was lost, and the Grey area is where material stayed the same. As you can see there is no grey area because every space was change even the slightest. I could have changed the amount of material change to allow for more grey to show up, but I wanted to show how no matter what in an uncontrollable environment everything will be effected even if it is only by a few millimeters. I can easily change this to conform to a clients specific wants and needs.

Figure5  (07/22/2017)
Figure 6 (09/30/2017)
Figure 7
Conclusion: 
I have proven that I have the abilities and knowledge to find the volume of a smaller area such as the pile in Figures 1-3 and larger areas in Figures 5-7. These are skills that will put me above the rest of the people in my career field.


Wednesday, June 5, 2019

Open Source GIS and Volumetrics

Intro:

I had an amazing opportunity to get a private lesson today from Dr. Christina Hupy. She is a highly respected professional and expert in the GIS Field. She was a professor at The University of Wisconsin for 11 years then entered the private sector where she has solidified her spot as a subject matter expert when it comes to Open Source and GIS.

We used an open source program called QGIS. This program has a number of different open source systems for all different uses. The reason why we wanted to use QGIS or other open source programs is because open source programs are usually free compared to closed source programs such as Pix4D that cost thousands of dollars every year.

Volumetrics:

With the program Open Drone Map we learned how to do the basics of volumetrics through this system. It was a simple process that would be almost impossible to do without help your first time through.

-First we needed to add the imagery and DSM of the Litchfield aggregate mine into the database.
-Then we needed to create a new shape file then a new layer.
-Find the pile that you want to find the volume of, make sure the digitizing tool bar is on.
-Start editing by tracing the pile then clip raster.
-View your log panel to find your base lever
-Open the Saga Raster volume tool
      A. Enter the pile DSM.
      B. Enter the base level.
      C. For the method choose (0)
      D. Run the Demo for volume tool.

Discussion:

Now I realize that these steps are very hard to follow and make no sense without looking at the actual site and following along yourself, but sense it is an open source you can download the software for free then follow these steps and find the volume of a data set that you have.

The figures below are to show what you will see as you proceed with the process and what the data looks like and how to read the data.

Figure 1: This is the Litchfield orthomosaic with Pyramids turned on to give dimension to the image.

Figure 2: This is the pile that I decided to get the volumetrics of. The red out line is after I started editing through the digitizing tool. 

Figure 3: The blacked out area is the area that I traced. It turned black once I clipped the raster creating another layer, a lot like a cookie cutter image of the trace.

Figure 4: This is the actual data that you will get at the end of the entire process. This is the final product that you will need to turn into your clients unless the want the weight of the pile, I will go over how to find that out in the next step. The base level is the height that the software calculated everything above in the blacked out section (235.7 m). The Grid Volume is the actual volume of the actual pile (305.821087 cubic meters)

Finding the Weight: To be able to find the weight of the pile you need to know the bulk density of the material in the pile. different materials have a different density. For example a feather wont have the same density of a brick. Without the bulk density you can't accurately calculate the weight of the pile.
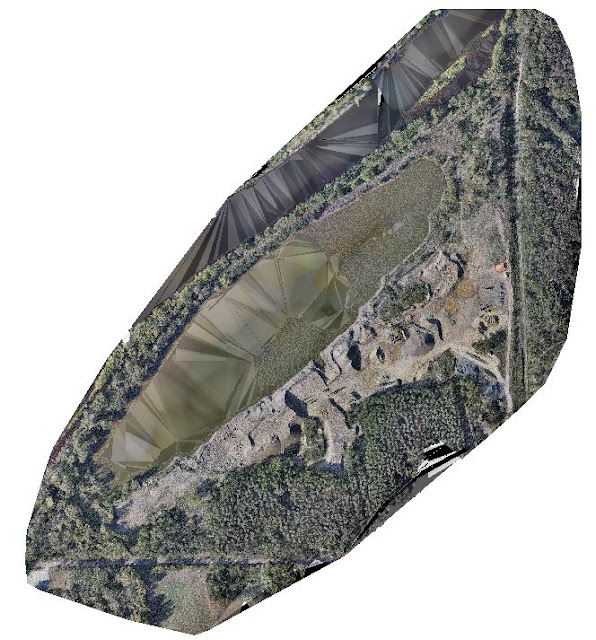
Figure 1

Figure 2

Figure 3
Figure 4

Conclusion:

This information is truly priceless because it is what will separate me from the rest of image and data collectors. I will be able to save whatever company I work for by having the knowledge on how to operate a free open source software system compared to having to spend thousands of dollars a year on closed source software. 
Bramor

Intro:
As useful as quadcopters are sometimes you need to use a fixed wing UAV. Today my crew got to work with the Bramor UAV which is a top of the line UAV.

Study Area:

Purdue Wildlife Area was used for the location to gather data with the intent to map the ponds on 6/3/19. The weather was 72 degrees F and sunny. Wind variable. The Bramor was the platform used and was flown at 120 meters at the speed of 16 meters a second. No GCPs were used in this mission since the Bramor was using post processing kinetics (PPK). Furthermore, GCPs in fixed wing operations would take a considerable amount of time to lay out given that the area covered is far greater.

Methods:

Bramor
Before leaving for the field we went through a checklist that was very detailed. This allowed us to realize that our PPK was not charged all the way. This would have skewed our data to the point that is would be unusable. The Pilot was William Weldon and the flight was approximately 20 minutes. The rest of the crew was used as Visual Observers. We used a catapult launch to make sure that we had a successful launch.


Discussion:

The Bramor mission was very successful and uneventful. In the word of Dr. Hupy "My favorite flights are uneventful flights, because that meant that nothing went wrong!" A major factor of successful flight was the delegation of the checklist and the thoroughness of the communication. We used a walki-talki app so that the entire crew could communicate in real time in case anything was to go wrong. This is so critical because the Bramor is a completely autonomous UAV platform. Meaning once it takes off you can't control it unless you hit return to home/launch and deploy the parachute.

We had to mat down the grass on the edge of the catapult to ensure that no grass got in the way of the launch. We also had to make sure that the catapult was far enough away from any trees so the Bramor could climb above them without any chance of hitting them.

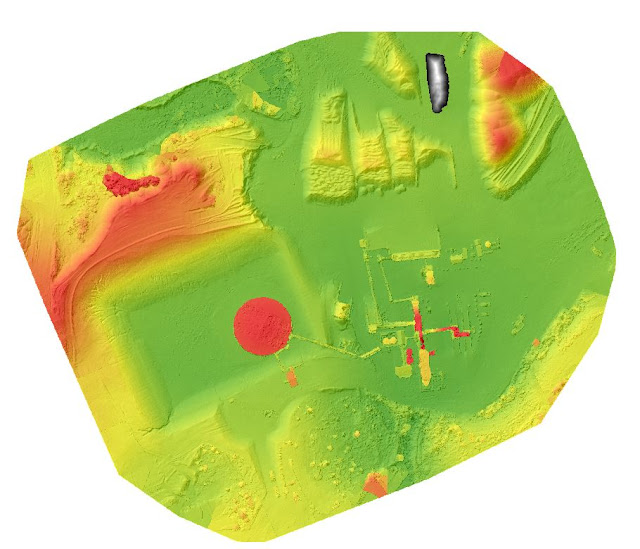
Bramor Orthomosaic

Conclusion:
Checklists and attention to detail can make or break not only a flight, but a crews reputation. Being very cautious every time is critical especially when you are dealing with a fully autonomous UAV platform.

Monday, June 3, 2019

Field Notes 3

Intro:

UAS can be used for more than just mapping out fields for agricultural use! They can also be used to map out debris fields from natural disasters and that is exactly what we did in this mission.


Study Area:

My crew flew over a barn at the coordinates of, 40°29'26.1"N 86°59'45.0"W, a location known as "Purdue Acres" where an old barn got destroyed by a tornado. We flew three missions, however we were only able to complete two. The platforms used for these missions were the Mavic 2 Pro and the H 520.


Methods:

The first mission was flown by Evan Brueggemann and myself using the Mavic 2. We flew the mission through the pix4D app and had no problems. We flew it manually where I took a video of the debris field then switched roles so that Evan was flying and he flew the debris field taking pictures.

The second mission was of the same debris field and this was flown with the H 520 by James Borders and Jeremy Cousins. They used the H 520 system itself to plan out the mission.


Discussion:


When you look down at Figure 1 you can see that the coverage of the debris field isn't really that bad! we have very good overlap for the majority of the center of the field. Then around the edges our overlap starts to take a drastic turn and we are lucky to get any overlap in some areas. The reasoning behind this poor overlap is very simple! When we flew the mission wanting to compare the outcomes of the orthomosaics between a flight not using a mapping app and a flight using one.
Figure 1
When you compare Figure 2 (Mavic 2 Pro) and Figure 3 (H 520) you can see a clear difference in quality of the images and the shape of the orthomosaic. Figure 2 is very unprofessional and looks like a fifth grader stitched it together. This is not what a company would want turned in of they were paying you to fly the debris field. Figure 3 is what the company would want, very square, sharp, and professional. We could easily of done any type of data analysis on Figure 3 and given that data to anyone who purchased the data.
Figure 2
Figure 3


Conclusion:

This experiment worked out perfectly, and turned out exactly how we wanted it to! We wanted to be able to show that not just any "Joe Schmo" can go out and fly anything and sell the data and images to a company. You need to have actual mission software to aid you in a mission to achieve true professional imaging and data collection.